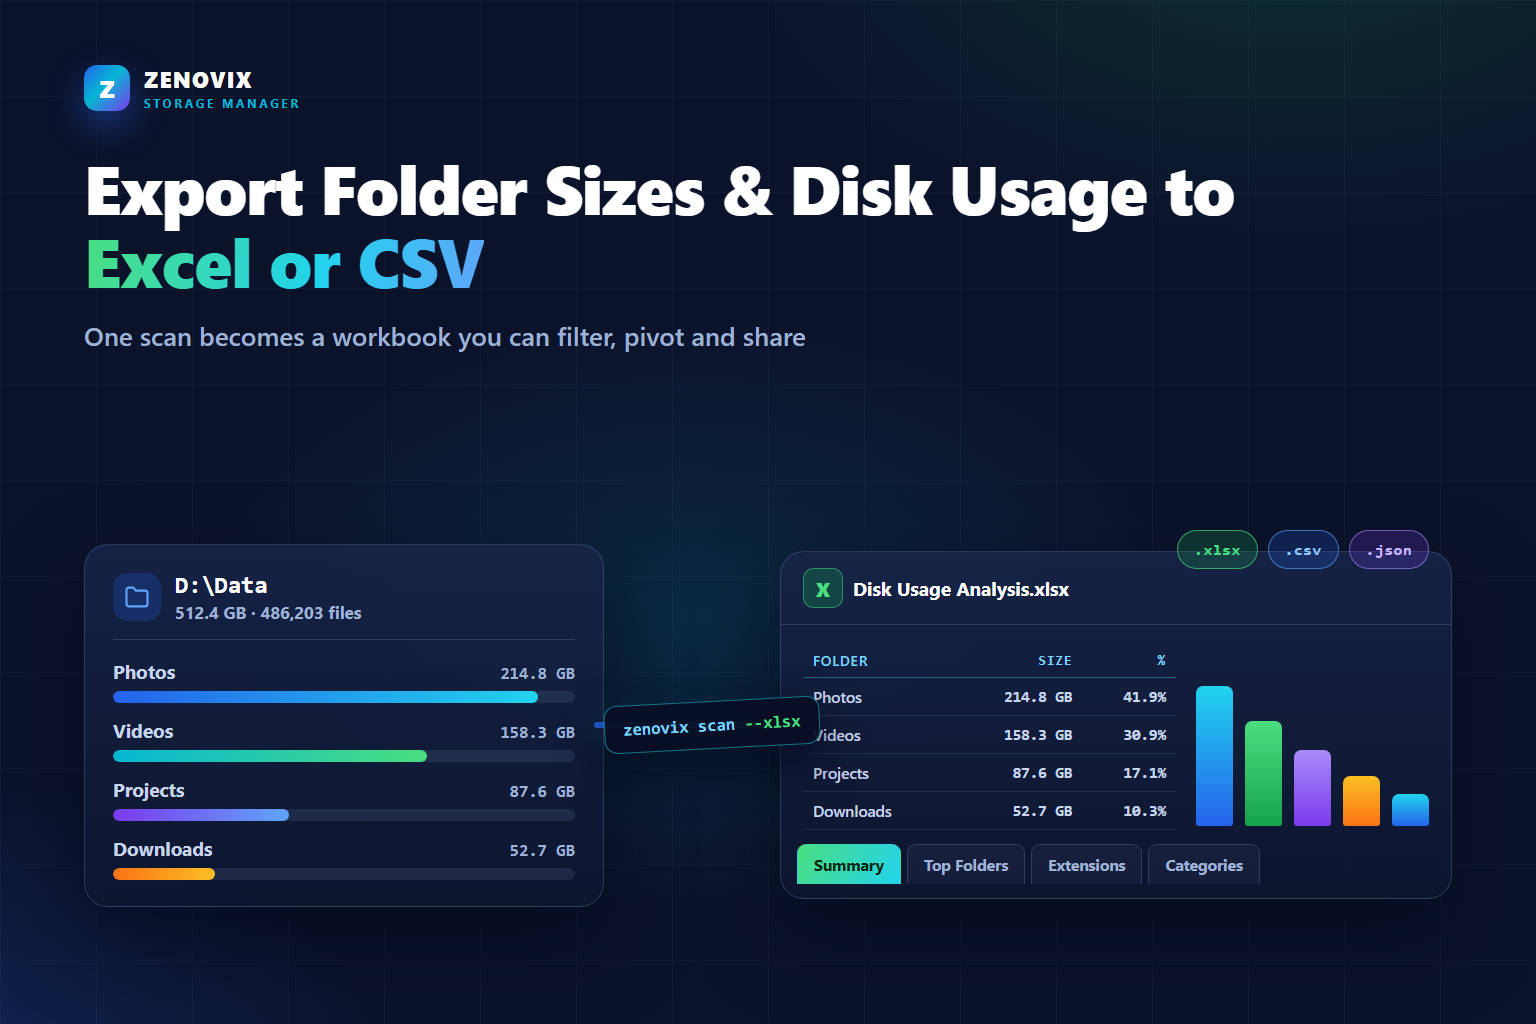
Why export folder sizes instead of viewing them once
A disk usage viewer answers one question: where has the space gone right now? The moment you close it, the answer is gone too. Exporting the same information to Excel or CSV turns a one-off glance into something you can actually work with.
A saved report lets you compare this month against last month and see which folders are actually growing. It gives you something to send to a colleague, a client or your future self, instead of a screenshot of a treemap. It lets you sort, filter and chart the data your own way rather than the way a viewer chose to present it.
For anyone managing more than one machine, a shared drive or a NAS, the case is even stronger. A folder size report you can regenerate on demand, or on a schedule, is the difference between guessing about storage growth and measuring it.
What a useful disk report should contain
Not every export is worth opening twice. A disk report earns its keep when it contains a few specific things.
First, a summary: what was scanned, when, how many files, how much total data. Without that header, a spreadsheet full of numbers loses meaning within weeks. Second, the top folders by size, because those are where cleanup and capacity decisions actually happen. Third, a breakdown by file extension and by category (photos, videos, documents, archives, developer files), which tells you what kind of data is consuming the space.
Finally, the report should note what was skipped. Folders that could not be read are not the same as folders that are empty, and a trustworthy report keeps the two apart. If the format also includes ready-made charts, so much the better: the report becomes presentable without any extra work.
Basic File Explorer and command-line approaches
Windows can get you part of the way with what is already installed. In File Explorer, right-clicking a folder and opening Properties shows its total size, and Settings > System > Storage gives a coarse category breakdown for each drive. Neither can be exported: you would be copying numbers into a spreadsheet by hand, one folder at a time.
The classic command line is closer. In a terminal, dir /s produces a recursive listing with a byte total at the end, and you can redirect it to a file:
dir D:\Data /s > sizes.txtThe result is a text dump, not a table. It lists files rather than summarising folders, the totals sit at the bottom of each section, and turning it into something Excel can chart is a project in itself. These built-in routes are fine for a quick answer about one folder. They are not a reporting workflow.
PowerShell options and their limitations
PowerShell is the first genuinely workable option that ships with Windows. A few lines will measure each subfolder and write a CSV:
Get-ChildItem D:\Data -Directory | ForEach-Object {
  $bytes = (Get-ChildItem $_.FullName -Recurse -File -ErrorAction SilentlyContinue |
    Measure-Object Length -Sum).Sum
  [PSCustomObject]@{ Folder = $_.FullName; SizeGB = [math]::Round($bytes / 1GB, 2) }
} | Export-Csv D:\folder-sizes.csv -NoTypeInformation
This works, and for a one-off answer on a modest folder tree it may be all you need. Its limits show up as the job gets bigger. Walking a large drive file by file in PowerShell is slow, and every run repeats the full walk. Long paths and permission errors need explicit handling or they silently skew the numbers. And the output is raw: one flat table, no summary, no extension or category breakdown, no charts — every run produces a CSV you still have to turn into a report.
In other words, PowerShell gives you data. It does not give you a report. If you enjoy maintaining scripts, you can build the rest yourself; if you want the finished workbook, that is the gap a reporting tool fills.
Creating an Excel, CSV or JSON report with Zenovix
Zenovix Storage Manager approaches this from the reporting end. The Zenovix CLI, part of Zenovix Pro, scans the folders, drives, UNC paths or mapped drives you point it at and writes the results in the format you ask for — a formatted Excel workbook, CSV, JSON, or several at once:
zenovix scan D:\Data --xlsx --output "C:\Reports" --top-folders 25
zenovix scan D:\Data --csv --output "C:\Reports"
zenovix scan D:\Data --json
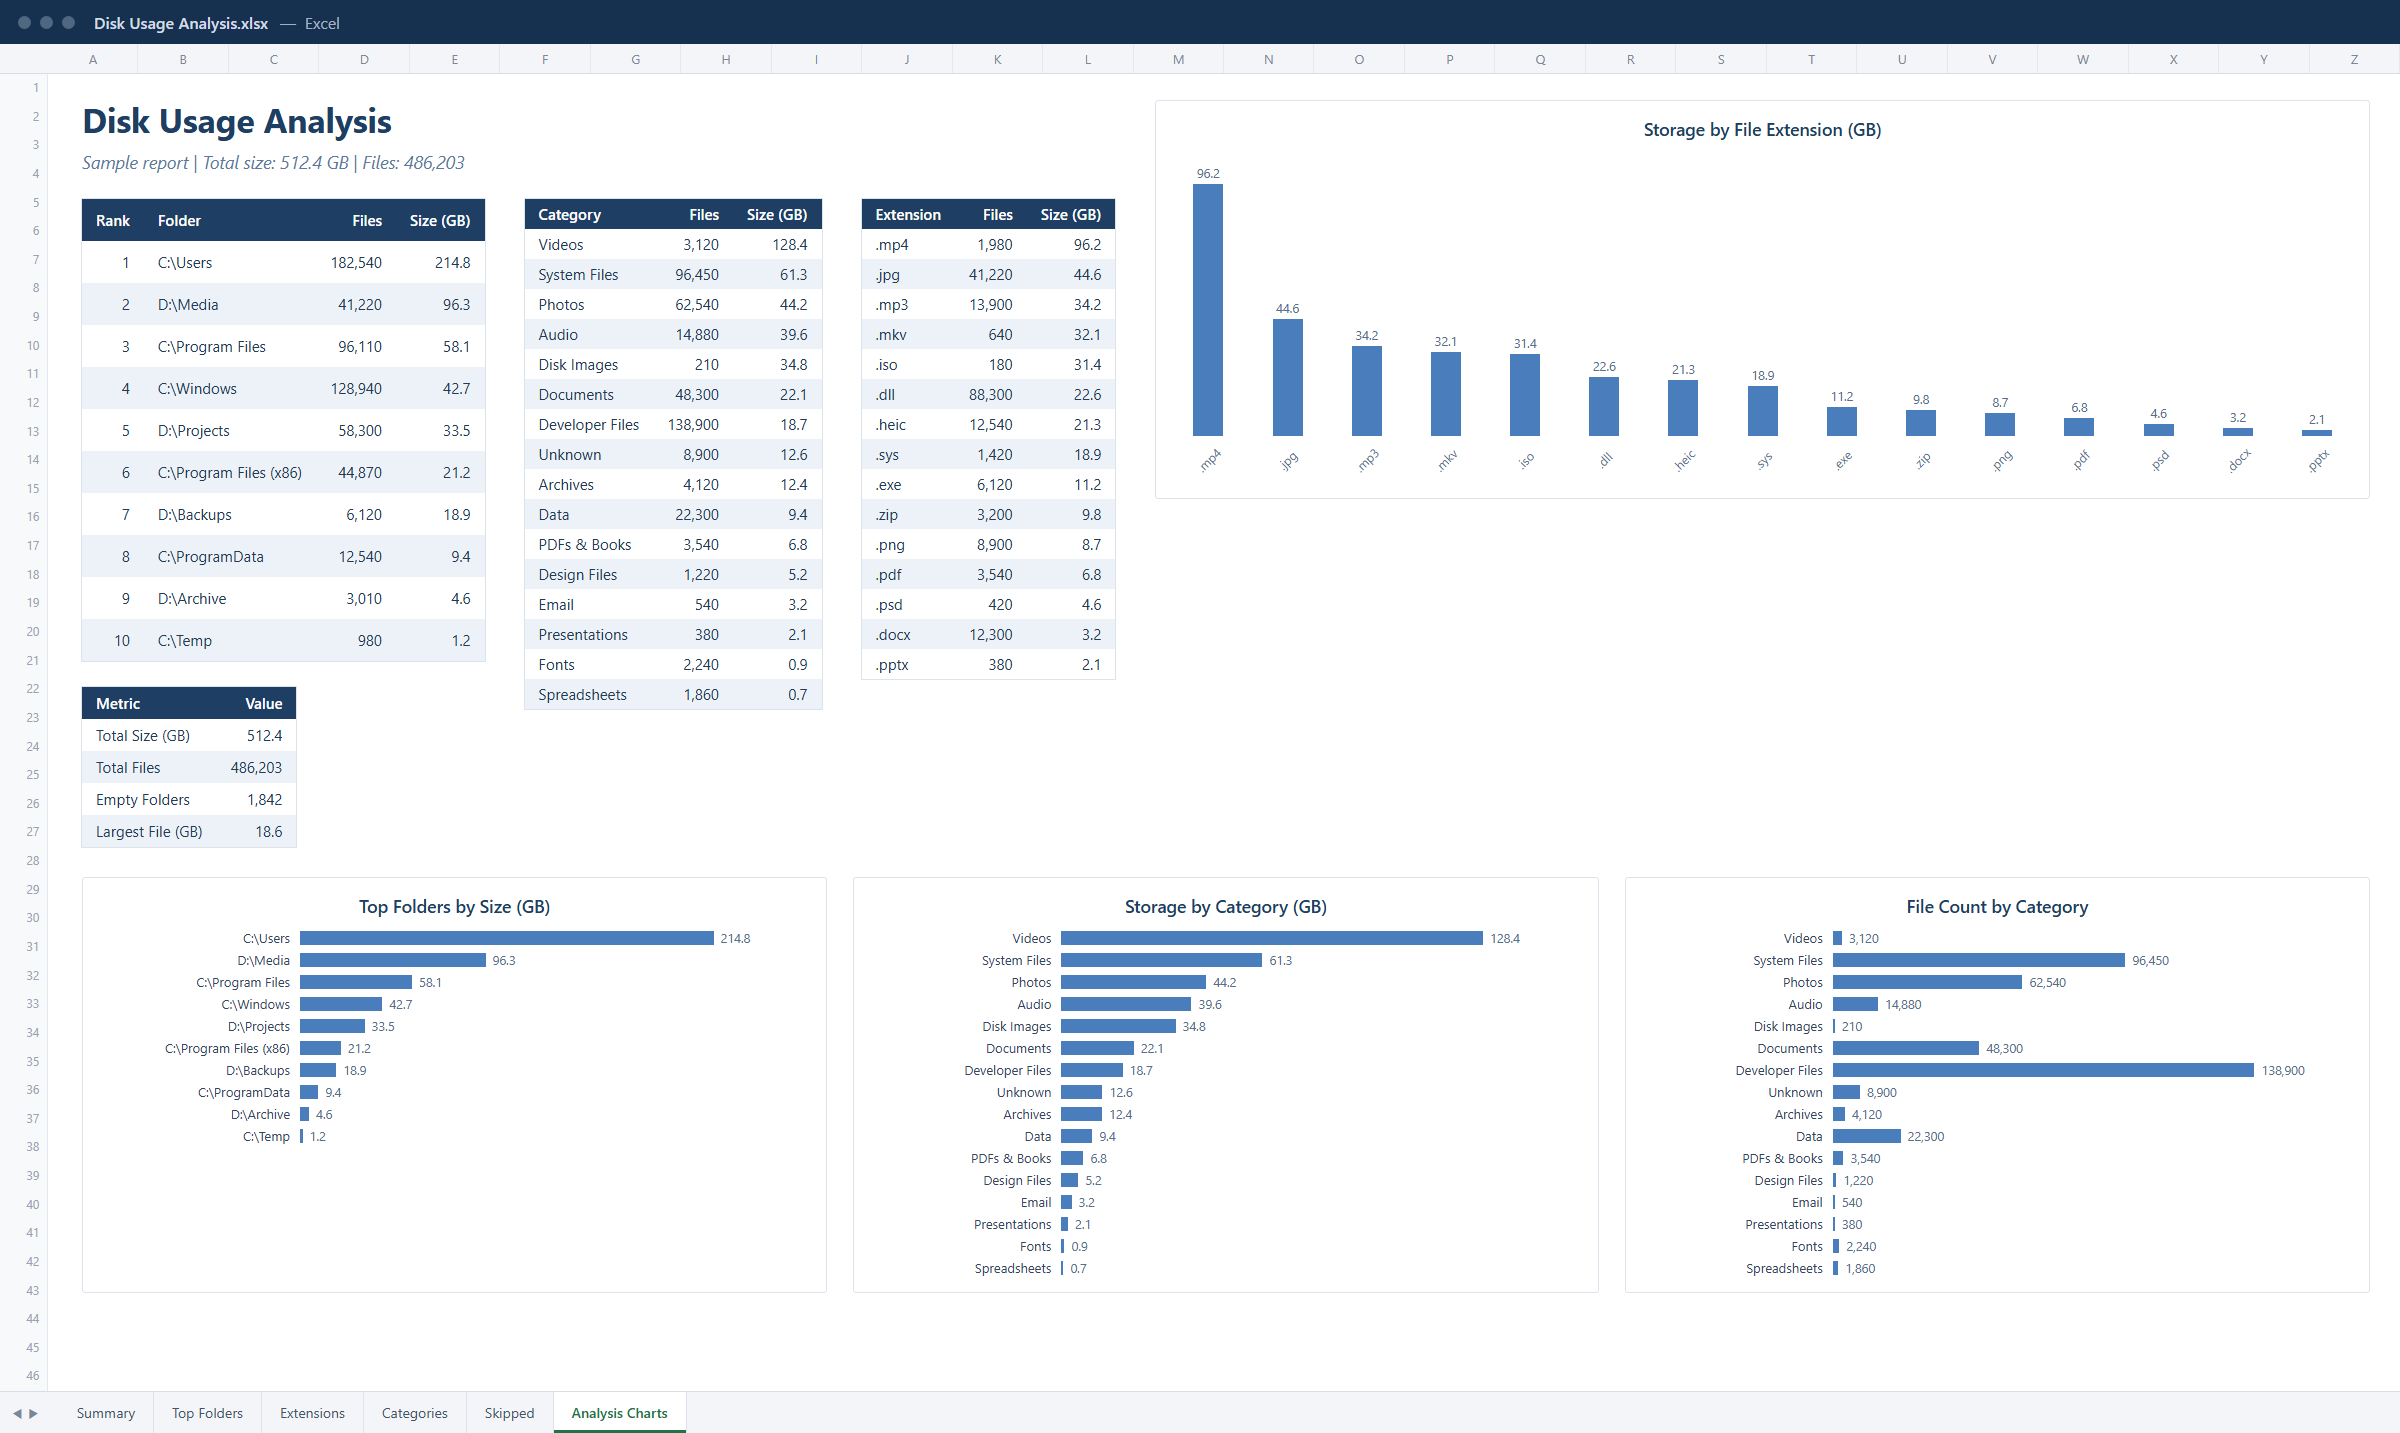
The Excel workbook is the headline act. It arrives already structured: a Summary sheet with the scan details, Top Folders ranked by size, Extensions and Categories breakdowns, a Skipped sheet recording anything that could not be read, and an Analysis Charts sheet with ready-made charts. It opens straight in Excel looking like something you would happily attach to an email.
Because the CLI is a command, scheduling is trivial: point Windows Task Scheduler at it and every run drops a fresh report. You can also append each scan to a Storage History Workbook, which snapshots results over time so storage growth, duplicate changes and top-folder movement become trends rather than isolated numbers:
zenovix scan "D:\Data" --history "C:\Reports\Storage History.xlsx" --xlsx --output "C:\Reports" --quiet --log "C:\Reports\zenovix.log"You can see exactly what the workbook looks like before buying anything — the sample below is a real report generated by the CLI.
Reading the top folders and file type tables
Once the workbook is open, two sheets do most of the explaining. Top Folders is the action list: it ranks the largest folders with their sizes and share of the total. Read it with the path in mind, not just the number — a huge folder of original photos is not a problem to fix, while a huge folder of forgotten exports usually is.
Extensions and Categories answer a different question: what kind of data is this? A drive dominated by .mp4 and .mov tells a different story from one dominated by .zip and .iso, even at identical totals. The category view groups extensions into human terms — photos, videos, documents, archives, developer files — which is usually the level you want when deciding what to archive or move.
Glance at the Skipped sheet before trusting any total. If entire folders could not be read, the drive holds more than the report shows, and knowing that changes how you read every other number.
Using filters and pivot tables in Excel
Because the export is a proper table, Excel's own tools take over from there. Select the Top Folders data and press Ctrl+T to make it a table, and every column gets a filter: show only folders above 10 GB, only paths containing a project name, or sort by size share.
Pivot tables go one step further. Insert a pivot from the extensions data and you can group, subtotal and reslice the drive any way you like — extensions summed into categories, categories compared by file count against total size, and so on. The charts on the Analysis Charts sheet are ordinary Excel charts too: recolour them, retitle them or copy them into a report of your own.
None of this needs anything beyond stock Excel. That is the practical benefit of a formatted workbook over a raw script dump: the analysis starts immediately instead of after an evening of cleanup.
Loading CSV or JSON into Power BI
For dashboards, the CSV and JSON exports are made to be picked up by other tools. In Power BI Desktop, use Get Data > Text/CSV for the CSV export, or Get Data > JSON for the JSON file; each scan becomes a table you can model, chart and slice like any other source.
The combination with scheduling is where this gets genuinely useful. A scheduled CLI scan writing to a fixed path means Power BI can refresh against the newest data without anyone touching a thing — a storage dashboard for a machine, a shared drive or a NAS that stays current on its own.
For longer-term history, Zenovix can also export scan snapshots to ODBC-compatible databases, which suits BI reporting and trend analysis at a scale where files stop being convenient. Whichever route you choose, the pattern is the same: Zenovix produces the data, and your reporting stack consumes it.
How read-only reporting differs from cleanup automation
One design decision matters more than any feature here: the Zenovix CLI is read-only by design. It deliberately has no delete, archive, restore, cleanup, move or rename commands. A scheduled report can run against your data every night for a year and never change a single file.
That separation is intentional. Measuring storage is a job you want automated — frequent, unattended, boring. Changing storage is a job you want reviewed — deliberate, visible, human. Tools that blur the two are how automated "cleanup" ends up deleting something that mattered.
In Zenovix the two live in different places: reporting is automated through the CLI, while cleanup stays in the app, where files are scanned, reviewed and only then archived, sent to the Recycle Bin or deleted — each step chosen by you. If you want the fuller picture of that workflow, the complete cleanup guide linked below walks through it.
FAQ
How do I export folder sizes to Excel on Windows?
Use a tool that writes a workbook directly. The Zenovix CLI command "zenovix scan D:\Data --xlsx" produces a formatted Excel report with summary, top folders, extensions, categories and charts. PowerShell can export raw folder sizes to CSV, which Excel can open, but you build the formatting yourself.
Can I get a disk usage report as CSV or JSON?
Yes. The Zenovix CLI writes CSV and JSON with the --csv and --json options, alongside or instead of the Excel workbook. The files are plain tabular data, ready for PowerShell, Excel or Power BI.
Can PowerShell create a folder size report?
Yes — Get-ChildItem with Measure-Object can sum folder sizes and Export-Csv writes the result to a file. It is workable for one-off checks, but it is slow on large drives, needs error handling for long paths and permissions, and produces a flat table rather than a formatted report.
Can I schedule a Windows disk space report?
Yes. Because Zenovix reporting runs from a command line, Windows Task Scheduler can run it on any schedule. Each run writes a fresh report, and the --history option appends results to a Storage History Workbook so growth is tracked over time.
Will generating a report change or delete any files?
No. The Zenovix CLI is read-only by design and deliberately contains no delete, archive, move or rename commands. Cleanup happens separately in the Zenovix app, after review, and only when you choose it.
Can I use the exports in Power BI?
Yes. Load the CSV via Get Data > Text/CSV or the JSON via Get Data > JSON in Power BI Desktop. For long-term history, scan snapshots can also be exported to ODBC-compatible databases for BI reporting.
Reports, not guesswork
Turn any folder or drive into a report your tools understand
Zenovix Pro's CLI writes formatted Excel workbooks, CSV and JSON from any scan, appends history workbooks for trend tracking, exports to ODBC databases, and stays read-only by design — your files are measured, never modified.